
SUMMARY:
Lunar-Solar TIDES are exhibited in both oceans and on landmasses; they exhibit rising and falling of seawater daily, and UPLIFT-SINKING of the earth’s CRUST on a kilo-year to million year basis. The large RATIO of TIMES is due to the ratio of the viscosities of crust/water (which is near 100 million to 1). The oceanic TIDES in the open seas absorb most of the GRAVITATIONAL ENERGY, but regularly there is a “JERK” forming SEAMOUNTS in a circular pattern. Harmonics create these patterns in many SCALES- from meter to km to mega meter ARCS. The largest for the earth is that of the TRANSFORMS- which are 40,000 km in length, when extrapolated (40Kkm-the circumference of earth). These TIDES are concomitant with POLAR WOBBLE- which results in 2 adjacent features:
1. FLAT and
LEVEL AXIAL CYCLES (Milankovitch’s constant tilt angle 41k.y. wobble and
harmonics), and
2. TILTED PRECESSIONAL CYCLES,
due to the regular change of the TILT ANGLE of the poles.The combination of these two rotations produces an ANALEMMA, SURROUNDED BY AN ELLIPSE. This is an almost complete FIGURE 8, which occurs throughout the earth’s crust, as double adjacent rotations with a diameter ratio of 1.6 (axial/precessional diameter ratio).

The TILT ANGLE PRODUCES a VERTICAL RISE (SCARP) which has a lateral/vertical dimension RATIO of 50:1, and produces geothermal effects whenever the scarp is more than 45 degrees from the vertical (chemical and solubility changes at SLICKENSIDES, warm seeps, hot springs, or vulcanism).
The regularity of the TIME PASSAGE for the AXIAL ROTATIONS may be used for TIME INTERVAL MEASUREMENTS (40.96 km/m.y. or its HARMONICS- such as the 4,096 m.y. age of the initiation of the MOON'S GRAVITATIONAL ATTRACTION), but is erroneous for the PRECESSIONAL CYCLES. ON-GOING CYCLE TIMES are equivalent to AGE, but the traces are preserved in the crustal rocks and may be younger than ROCK UPLIFT TIME, and are always younger than ROCK DEPOSITIONAL AGE.
 Coastal WATER TIDES are shown for 2 separate
weeks, for REFERENCE to COMMON OCEANIC TIDES vs. EARTH TIDES (we are
studying these in order to form a mathematical equation which will allow calculation of the time of DEVELOPMENT);
Coastal WATER TIDES are shown for 2 separate
weeks, for REFERENCE to COMMON OCEANIC TIDES vs. EARTH TIDES (we are
studying these in order to form a mathematical equation which will allow calculation of the time of DEVELOPMENT);
I have been using EARTH TIDAL FRICTION RATES categorized in 4 classifications: 10.24 mm/year in the NE and SE blocks, 20.48 in the NW, and 30.72 mm/yr in the SW BLOCK. This, according to that displayed by water tides, is an OVER-SIMPLIFICATION. The more correct procedure is to use a SINUSOIDAL VARIATION, STARTING with the middle of the NE side of any BLOCK, until reaching the middle of the SW block. BLOCKS are defined by a TRAPEZOIDAL DISPLAY of 2 or 3 linears separating an isolated uplift or sink- such as the PARIA PLATEAU, UT.

This involves 180 degrees rotation- such as that which you would see from a half day of water tides. During this time, coastal tides pass from one high to the following high (or low) water level. The EQUATIONS for this HALF CIRCLE in the EARTH'S CRUST are as follows:
TIDAL FRICTION MAGNITUDE, M = 10.24(1 + sine A) where A= angle between 0 and 90 degrees. This results in 17.48 mm/yr at the border of quadrants (usually the N-S loxodrome), and 20.48 at the NW maximum. Continuing, from 90 to 180 degrees, the magnitude:
M = 20.48 +10.24 sine B, where B is the angle between the NW and SW locations. This results in 20.48 at the NW corner and 30.72 mm/year at the SW corner of the block:
At the SE and NE corners of the block, there is a constancy of TIDAL FRICTION- essentially LINEAR frictional slowing, due to the SUN’S INFLUENCE.
From the SW to the SE corners, there is a continual TIDAL FRICTION DECREASE- from 30.72 to 10.24 at the SE corner:
M= 30.72 -20.48 sine C, where C = 0 to 90 degrees at the SE corner. This results in a variation from 30.72 at the SW to finally 10.24 mm/yr at the SE corner. The magnitude at the southern extremity is 13.24 mm/yr. (NOTICE THAT THE ADDITION of extreme N and S magnitudes yields 30.72mm/yr.). The magnitude at the extreme west boundary is 27.72mm/yr, and can be remembered as the mid-point SW value - 3, similarly to the north boundary being NW 20.48-3mm/yr.

Weather cells show these features, but VAGUENESS prevents my PRACTICAL USE of them:

I will TEST THESE EQUATIONS with some GOOGLE EARTH CASES- first, with Whidbey Island:

I will improve on the ABOVE photo of Possession Point,after incorporating the SINUSOIDAL EQUATIONS:


The NORTH END OF
ALA SPIT is an excellent ELLIPSE; taking the part which is more circular (AXIAL
ROTATION), we can calculate the AGE:

Calculated TIDAL
RATE is unusually large; we will determine whether this is erroneous or correct
(ELLIPTICAL EARTH PATH in the last 5000 years- ICE AGE RECOVERY).


Notice that the measurement of the quadrant is not equal from side-too-side; this indicates that the quadrant is elliptical, not simply circular (a LOXODROMAL SPIRAL- notice the regular decrease of the RADIUS of CURVATURE, as a traverse is walked from the NE to the SW coastline).
This entails an error, since the arc will be NOT truly circular. Consequently the calculated age of 5543 years is too low. I have made added measurements, finally realizing that the quadrant center must be used- by drawing a line from the farthest north position of the spit to that at 135 degrees to the coastline (which should be the farthest west position). This line is divided into 4 parts to locate a 45 degree portion of the 90 degree quadrant. Then the 45 degree arc may be located for distance measurement along the coast line. This may be used to determine the diameter of the nearly circular arc, and the age calculated from diameter/20.48mm/year. The most accurately-calculated age is then 6000 years instead of 5543- 7.6% variation. This includes my personal measurement errors and that from tracing the arc along its path. There is a small error encountered from the not-quite-circular arc, but this case is probably the simplest (since there has not been sufficient time to create younger sinusoidal oscillations along the way- tits, bays, and other protrusions). This tedious determination of the accurate age of the circular movement may be eliminated, when an “eyeball method” is perfected for quickly finding the exact NW quadrant center. Checking this entire process may be made by measuring the angle (along with the distance) for each measurement, Google earth usage entails distortion whenever there is slanting of the presentation (OBLIQUE VIEW).
Incidently, after doing all this, I read the entrance SIGN, and found that some GEOPHYSICIST had already determined the SEA LEVEL STABILIZATION DATE; 6000 years. I think that they have "rounded it off", but this age coincides with my MORE ACCURATE CALCULATIONS.

An
improvement in AGE and TIDAL MOVEMENTS RATES involves selection of the QUADRANT
which allows the ARC TRACE to move along 90 degrees of SPATIAL
ROTATION:
a.
At the center of any quadrant outer trace, the
tidal rate is known: NE-10.24, NW-20.48, or SW-30.72 mm/yr- select an arc which
spans 90 degrees (a complete quadrant, and not more or
less);
b.
When there is no 90 degree arc, select a smaller
one which is centered about the exact quadrant TRACE CENTER (preferably a 45
degree segment);
c.
Select an arc which has NO SUBSEQUENT DISTORTIONS
(younger bays or spits-tombolos;
and,
d.
DO NOT USE ELLIPTICAL ARCS. They include portions
of two FEATURES- AXIAL and PRECESSIONAL MILANKOVITCH CYCLES, or their
harmonics.
The next COMPLICATION
involves the expense of GRAVITATIONAL ENERGY in creation of uplifts or rises.
With a rising ELLIPSE, the lateral TIDAL RATE is reduced; this may involve an
unknown magnitude, but my cases hint that the tidal LATERAL FRICTION RATE is
half NORMAL. Then the UPLIFT TIDAL RATE is half the LATERAL RATE OR
LESS.
I WILL TEST THIS METHOD WITH the HURRICANE
FAULT- COLORADO PLATEAU WEST BOUNDARY

An OBLIQUE VIEW
ALLOWS a vertical measurement:

From memory, the
approximate LATERAL TIDAL RATE for CP= 800 km/40 m.y. = 20mm/yr., and I will
improve this by a more careful calculation. The VERTICAL TIDAL RATE is
approximately 20,000 meters (before erosion of the stratigraphic column) /40
m.y.= 500m/m.y. this is .5mm/yr., or 1/40th of the
lateral rate. Above GOOGLE PHOTO indicates that the more correct RATIO = 1/45.
This is just a start in finding the UPLIFT RATE, and I will post others to find
if there is a consistency in the ratio of LATERAL/VERTICAL MOVEMENTS.
I MUST SOLVE the PHYSICAL PARAMETERS, which determine whether there is SINKING (as with SPIRALING BASINS), or RISING, as with the ZION NP, UTAH:


 Determining the RATIO of LATERAL/VERTICAL ROTATIONS
requires measuring vertically along a SCARP with a slope of more than 45
degrees; otherwise, there would be heat generated at the contact
of the 2 rotating ROCK ARC CONTACTS (warm seeps, hot springs, or stink). I have
already found that there is a contrast at the PACIFIC TRANSFORMS (e.g.
Mendocino, CA), where rising occurs at the south side contrasted with sinking
(subduction) on the north. The RATIO of lateral/vertical movements is 50:1,
or 360 degrees/7.2 degrees LATITUDE separation of major TRANSFORMS, where the Mendocino transform represents a circumference of the earth, if
extrapolated around the earth.
Determining the RATIO of LATERAL/VERTICAL ROTATIONS
requires measuring vertically along a SCARP with a slope of more than 45
degrees; otherwise, there would be heat generated at the contact
of the 2 rotating ROCK ARC CONTACTS (warm seeps, hot springs, or stink). I have
already found that there is a contrast at the PACIFIC TRANSFORMS (e.g.
Mendocino, CA), where rising occurs at the south side contrasted with sinking
(subduction) on the north. The RATIO of lateral/vertical movements is 50:1,
or 360 degrees/7.2 degrees LATITUDE separation of major TRANSFORMS, where the Mendocino transform represents a circumference of the earth, if
extrapolated around the earth.
 Above is the fairly undistorted (by
subsequent events) trace of Hf- the SEGMENT easily hiked and climbed, formed in
the last 2 m.y.
Above is the fairly undistorted (by
subsequent events) trace of Hf- the SEGMENT easily hiked and climbed, formed in
the last 2 m.y.
The separation of Pacific Transforms is 7.2 degrees of latitude at the COASTLINE of the Americas until Chile, South America (1/50th of the 360 degrees of a circle), and subduction continues from Mendocino, CA to the Olympic peninsula, WA, where vertical movement transpires. For example, subduction is reversed (RESULTING in a RISE of previously deeply-buried STRATA yielding major METAMORPHISM) for the NW USA at the rise of the Bitterroot Mts. Consequently, the depth of a semicircular subduction reaches 1/50th of 40Kkm or 800 km. This situation does not usually occur, since the arc of rotation is less than half-circular. A sixth of a circle- 60 degrees- entails subduction of .866 x 800km = 693 km, and a 30 degree VERTICAL arc entails 400 km subduction (which is observed with geophysical measurements).

 The case of the Hurricane Fault, Hf, is the most
familiar to me, since I have lived within 5 km of it, and hiked it extensively,
for 15 years. It has a SCARP of at least 200 up to 500 meters along its trace.
Google Earth photos below show that the LATERAL/VERTICAL RATIO is near 50;
analysis reveals some extra valuable information: most of the scarp exhibits an
ARC rotating about the MIOCENE-INITIATED PARIA PLATEAU, and the 16 m.y. EVENT
SHOWS A ROTATION along the Colorado River. 16 m.y is a significant time in the
BINARY THEOREM, with the formation of the DESTRUCTIVE COLUMBIA FLOOD
BASALTS.
The case of the Hurricane Fault, Hf, is the most
familiar to me, since I have lived within 5 km of it, and hiked it extensively,
for 15 years. It has a SCARP of at least 200 up to 500 meters along its trace.
Google Earth photos below show that the LATERAL/VERTICAL RATIO is near 50;
analysis reveals some extra valuable information: most of the scarp exhibits an
ARC rotating about the MIOCENE-INITIATED PARIA PLATEAU, and the 16 m.y. EVENT
SHOWS A ROTATION along the Colorado River. 16 m.y is a significant time in the
BINARY THEOREM, with the formation of the DESTRUCTIVE COLUMBIA FLOOD
BASALTS.


 The calculations reveal that the vertical TRENCH should be
400km/50= 8 km, or about 26,000feet. I will find the most accurately measured
depth from geophysical data.
The calculations reveal that the vertical TRENCH should be
400km/50= 8 km, or about 26,000feet. I will find the most accurately measured
depth from geophysical data.


I have made
the initial calculation of 45:1 for the L/V RATIO at Hf, which is 10% in error.
An ACCOUNT OF MY ERRORS HELPS to improve the analysis, but also to show the
CONFIDENCE or VALIDITY of the method or approach.
I MUST SOLVE the PHYSICAL PARAMETERS, which determine whether there is SINKING (as with SPIRALING BASINS), or RISING, as with the ZION NP, UTAH:

First, the bare
GOOGLE Map:

Then, the OBLIQUE
view to the Colorado River:

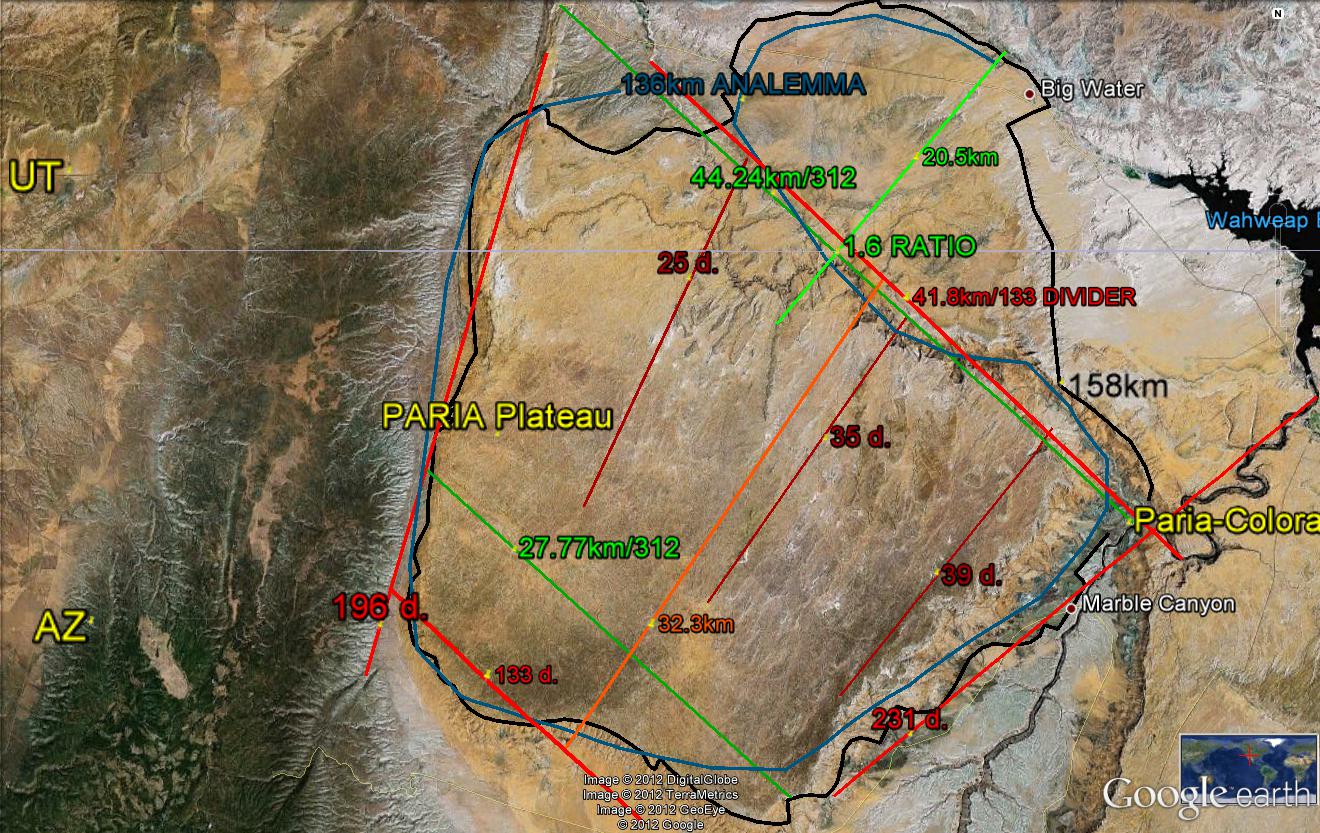
and finally, the
analysis to the PARIA PLATEAU:

 Above is the fairly undistorted (by
subsequent events) trace of Hf- the SEGMENT easily hiked and climbed, formed in
the last 2 m.y.
Above is the fairly undistorted (by
subsequent events) trace of Hf- the SEGMENT easily hiked and climbed, formed in
the last 2 m.y.The separation of Pacific Transforms is 7.2 degrees of latitude at the COASTLINE of the Americas until Chile, South America (1/50th of the 360 degrees of a circle), and subduction continues from Mendocino, CA to the Olympic peninsula, WA, where vertical movement transpires. For example, subduction is reversed (RESULTING in a RISE of previously deeply-buried STRATA yielding major METAMORPHISM) for the NW USA at the rise of the Bitterroot Mts. Consequently, the depth of a semicircular subduction reaches 1/50th of 40Kkm or 800 km. This situation does not usually occur, since the arc of rotation is less than half-circular. A sixth of a circle- 60 degrees- entails subduction of .866 x 800km = 693 km, and a 30 degree VERTICAL arc entails 400 km subduction (which is observed with geophysical measurements).


The
SEGMENT CLOSEST to my domicile is that "TIT" which has produced the 1 m.y. Ivin
and the later 1/4 million year Sullivan Knoll. This extrusion set is in an
ARCUATE PATTERN, along with the Red Ash and the Radio Tower craters. These
represent RISES, that are similar to that found at WARM SPRINGS PARK,
NV (on a much smaller scale).

Notice the COMMONALITY of a SCARP in the distance, a RISE in the FOREGROUND, orientation of the rises perpendicular (ORTHOGONAL) to the scarp, and geothermal events for both cases:

Warm Springs,
NV:

Analyzing MUDDY
sandstone, which surrounds Warm Springs (Pliocene to Miocene silts and ss. until
the basement limestones are encountered):
The calculations reveal that the vertical TRENCH should be
400km/50= 8 km, or about 26,000feet. I will find the most accurately measured
depth from geophysical data.
I will test the 50
RATIO of LATERAL/VERTICAL movements with that along the famous Virgin canyon at
the MUDDY sandstone-BEAVER DAM MTS. contact near the town of LITTLEFIELD, AZ.
This has Tertiary deposition as much as 25,000 feet, from the literature. We
will use the 50 ratio to determine VALIDITY:

There is still
SIGNIFICANT ERROR, so use the GALAPAGOS ISLANDS as a reference, since they are
positioned at the EQUATOR. There is no CORIOLIS EFFECT at this latitude, so
there should be one less variable to incorporate:

Let's now pick a feature on another continent, to find whether there is validity to the Coriolis and Milankovitch rotations- Talara, Peru, a desert on the extreme westernmost PROTRUSION of the south American continent (ABOVE^)
Notice that there is exhibited a CONTINENTAL SHELF, which is sinking as a SPIRAL. THE lunar effect is only half the SOLAR Now I know that it is a sink- where the 2 ARCS are pulling apart from each other (with rising, the arcs would be pushing towards each other). The SOLAR INFLUENCE IS DOMINANT, compared to the lunar. Conversely the land is rising (notice the ellipse on the immediate coastal area; this indicates how the OIL was percolated into the SUBSURFACE by squeezing- this is called a STRATIGRAPHIC TRAP.
Now look at the 2nd largest feature on EARTH- the CONTINENT of Africa-and how it follows similar RULES for GRAVITATIONAL LATERAL EARTH TIDAL MOVEMENT and RATES:
 NW Africa is lagging, while the BULGE is leading; this exemplifies the 3X rate for the SW of a given BLOCK of CRUST, compared to the NE:
I have plotted the 100x MULTIPLES of the APPROPRIATE EARTH TIDES, according to which QUADRANT they inhabit. This results in a PARALLELOGRAM- which is the parent of LAND-BASED TRAPEZOIDS (erosion accounts for the significant difference, and there is much less of it at the sea bottom than on continents). There is only 3.6% error in CLOSING OUT (in surveyors parlance), and this stoutly reveals that EARTH TIDES OCCUR not only on a continental scale, but at the predicted trigonometric magnitudes (20.48mm/yr in the NW QUADRANT, and 30.72 in the SW- near the equator, where there is exhibited a tremendous TIDAL SHOVE to the WEST!)
This accounts for the CONCENTRIC SHAPE (relative to Africa's west coast) of the MAR- MID ATLANTIC RDGE- as it moves westward with time. Questions you should ask:
1. When the MAR moves westward with time at 20.48 mm.yr, how is that Qsna- which is moving westwared at the same rate- develops a SPREADING CENTER-MAR?
The answer is: Minor or subsequent events create local events, such as VOLCANIC ISLANDS on a kilo-year scale, and this exhibits extrusions (Azores, Canary Islands, etc.)
2. Since the measured radioactivity AGE occurs on either side of MAR, how does the oldest Qsna feature (immediately to the west of MAR) move westward with time?
The answer is: The smaller concentric circle of EARTH TIDES-INDICATED DIAMETER is always the younger, and this is the case with those west of MAR; they are younger and form to the west progressively, because of the shove to the west.
3. Why is the MAR not concentric with features to the west in Qsna?
This is immediately a PRECESSIONAL CYCLE- which is aways ragged compared to the AXIAL, or Africa (harmonics of 20.48 are FLAT-LEVEL, NOT TILTING, while harmonics of 30.72 are tilted and changing with time (POLAR TILT ANGLE CHANGES with the precession of the EQUINOX).
BELOW is the INFLECTION POINT, where the MAR TIDAL RATES CHANGE from moderate to FASTEST (except for SPIRALING-RISING or SINKING, e.g. at HI-Emperor seamount chain, with 86 mm/year). The occurrence at this IMPORTANT GEOMETRICAL 30 degrees N. Latitude is indicative of the CHANGES at FRACTIONS of the EARTH'S 360 degree CIRCUMFERENCE!


Magnifying the region about the younger UPLIFTING ISLANDS of the Azores and Madeira (some more MADEIRA, my dear?), we see that the 40N latitude is significant in GLOBAL GEOMETRY:

EXPANDING:


Enlarging the OBVIOUS ANALEMMA to the SE, we see that SOLAR TIDES have formed the northern part of the archipelago, and LUNAR TIDES the south (consequently, there have occurred 3x multiple TIDAL RATES, from north to south- requiring 3 times as much time to form the NE segment):


Left or west of MAR is the NW CORNER of Qsna- the NORTH AMERICAN QUADRANSPHERE; this region can be expected to yield 10.24 mm/year EARTH TIDES to the west. A CALCULATION of adjacent features shows a small error of a few percent below 10.24. This gives us confidence to proceed.
Continuing for SIGNIFICANT FEATURES for the whole globe, to ensure that this TIDAL ANALYSIS is pertinent to other QUADRANTS, BELOW IS SHOWN THAT FOR THE MARIANAS (where the trench is a SINGULAR FEATURE):
 We find that a basin has developed to the east of GUAM, where it tilts to the west, and is measured at 250 km, with the deepest part being at a depth of 5 km- again a RATIO of 50:1:
  West of Guam, Marianas islands, and NW of the "deepest in the world" TRENCH, is a basin which will help in solving the RISING-SINKING DILEMMA. This is SPIRALLING DOWNWARD, and has a TILT DOWN TO THE WEST, with a ration of SPREAD/DROP pf 50:1. This is valuable for the OIL EXPLORATION boys, where the orientation of drilling should start with the SHALLOW DEPOSITS, and proceed to those in the DEEPER REGIME. This gives an EXPLANATION for such OILFIELDS as the ANARDARKO BASIN, which not only has GEOPRESSURE due to the DYNAMIC MOVEMENT of the SHEARING ROTATIONS, but it explains why there is unusual TEMPERATURE, PRESSURE GRADIENTS, and STRATIGRAPHIC TRAPS (PLUS the MAXIMUM DEPTH to the BASEMENT, where no hydrocarbons can be expected).
The case of MADAGASCAR-AFRICAN RIFT (offshore) illustrates that EARTH TIDES are gradually changing: from the OMNI-PRESENT SUN’s 10.24 mm/year to 30.72 when the NEW MOON adds its contribution. The FULL MOON creates maximum friction with the EARTH’S SURFACE for at most 4 days. After and beforehand, TIDAL FRICTION is reduced from westward to eastward- becoming maximum COMPRESSIVE at the new moon. The full moon and the sun pull the earth in opposite directions (CREATING EXTENSION) about one- sixth of the time, and this may account for the 13.6mm/year calculated for the RIFT-MADAGASCAR ROTATION of 60 to 116 m.y.
Compare EARTH TIDES with observable WATER TIDES; THE USUAL TIDE MOVES TO A MAXIMUM, remaining high for an hour or so. The in-coming and ebb contribute another 2 hours of high water. But this is a sinusoidal function, and it remains at a constant level (HIGH or LOW) for less than an hour! AFTER SUN’S TIDAL FRICTION, MOON’S is DOMINANT, but only for a portion of the time. Analysis of the Gulf of Mexico basin (a large feature, with maximum GOOGLE EARTH DETAIL) reveals that a quarter to a half of the rotation exhibits less than 20.48 mm/year TIDAL FRICTION. This represents at least a QUADRANT of the ELLIPTICALLY-SHAPED BASIN! This emphasizes that:
1. AGE or time interval measurement requires that the SPECIFIC QUADRANT (of four) for any block of crust be known;
2. The separate block must be determined from PARALLEL SHEAR LINES- which approximate a TRAPEZOID, with at least one side indeterminate (e.g. PARIA PLATEAU);
3. The calculation of TIME INTERVAL= ARC DIAMETER/friction RATE, MUST be independently assessed, using either LOCAL GRID SEPARATION, or AXIAL CYCLE DIAMETER (e.g. COLORADO PLATEAU); and,
4. The largest and widest CONTINUOUS ARC must be used for MAXIMUM TIME INTERVAL. There will occur other smaller arcs which are enclosed within the largest, and these represent subsequent EARTH WAVES. A good test is that they are concentric. There will ALWAYS OCCUR an opening or GAP or missing portion of a complete circle, and this may display another SERIES of ORTHOGONAL PARTIAL ARCS (e.g. analemma or figure 8 for another block of crust).
The above admonitions are made MORE COMPLICATED by the significant influence of VENUS’S GRAVITY (and of the other planets- according to their distance and mass: m/d). I am still solving these relations, but it appears that smaller masses in space result in SMALLER HARMONICS for smaller features (e.g. Sand Hollow and Mountain, UT- near the Hurricane fault, Hf).

MORE WEATHER EXHIBITS (with the goal of determining the use of ATMOSPHERIC TIDES as an indicator of EARTH TIDES, LOOP CURRENTS in the seas, and FEATURES in advance of HURRICANES and TORNADOS):

 I am displaying the weather maps of Hurricane Isaac,
which developed from a tropical storm into a category 1 Hurricane on August
29/2012. This drenched the Louisana coast near New Orleans and stalled:
I am displaying the weather maps of Hurricane Isaac,
which developed from a tropical storm into a category 1 Hurricane on August
29/2012. This drenched the Louisana coast near New Orleans and stalled:
Huricanes are the
DESTRUCTIVE END of larger phenomena: they are developed from PRESSURE WAVES
formed west of the African Coast, and are guided by GRAVITATIONAL TIDES,
LATERALLY. They move along an ARCUATE PATH, turning when the critical 30N
latitude is passed. At this location, circulation changes from east winds to
west or NW.
 Yellow bands of heavy rainfall show the
CCW rotation excellently; the SPIRAL never closes to a FULL CIRCLE, just as
earth TIDES DEVELOP. There is always a corner left unconnected, and this is
where a secondary rotation will develop:
Yellow bands of heavy rainfall show the
CCW rotation excellently; the SPIRAL never closes to a FULL CIRCLE, just as
earth TIDES DEVELOP. There is always a corner left unconnected, and this is
where a secondary rotation will develop: Multi-states show the LARGER PHENOMENON,
above.
Multi-states show the LARGER PHENOMENON,
above. One day PRIOR, the hurricane can be seen as part of a
larger rotation- on the edge of a great CW HI pressure cell. 10 days prior,
there are SHEAR FEATURES shown by the linear arrangement of clouds:
One day PRIOR, the hurricane can be seen as part of a
larger rotation- on the edge of a great CW HI pressure cell. 10 days prior,
there are SHEAR FEATURES shown by the linear arrangement of clouds:
Sufficient photos of daily EASTERLY WAVES should
allow determination of the CRITICAL FACTOR which causes some westward waves to
form hurricanes, while 75% die without more than high winds and rain. This has
eluded the meteorologists so far. The vital entity to solve is the
GRAVITATIONAL LATERAL SHIFTS which intensify the regular development (it isn't
just a HEAT ENGINE, depending on warm water):

I will record the PROGRESSION of the TROPICAL to finally become a HURRICANE, from Aug 11 to landfall on the 30th:

I have a week of photos, prior to Isaac making landfall:


And finally deteriorating into a DESTRUCTIVE RAINSTORM:
 I will NOT TOO EAGERLY AWAIT another HURRICANE DEVELOPMENT this season (we should have an extended period of dangerous blasts).
Below is Leslie, which hurtled towards Bermuda and by-passed the continent:

FORE-RUNNERS will eventually provide CLUES to those TROPICAL STORMS, EASTERLY WAVES, and PATTERNS which develop DANGEROUS HURRICANES:

Weather on Sept 8 has easterly WAVES APPROACHING:

I will post the PORTRAITS, as the 6-8 day easterly waves move WESTERLY: